
Thermal comfort in buildings
An introduction into occupant thermal comfort theories and their impact on our built environment.
1. Thermal comfort and sustainable design
Developing a sustainable architectural project requires understanding occupant thermal comfort as a key driver. Most energy in a building’s lifespan is spent on heating and cooling to meet occupants’ thermal demands.
Throughout history, architecture has addressed occupant thermal comfort, taking a more scientific approach ever since we started conditioning our spaces. But before exploring comfort theories, let’s quickly review the concept of thermal balance.
The human body continuously loses heat to its surroundings as a byproduct of metabolizing chemicals from food into mechanical energy. The ammount of heat dissipation depends on metabolic rate, varying with age, gender, physical condition, and activity level. Metabolic rate is then manifested as energy over time, as shown in the table below (expressed in kcal/hr).
Activity
Complete rest
Minimal activity
Light work
Light physical work
Strenuous physical work
Child
60
80
90
100
115
Adult
75
100
105
125
150
Reference metabolic rate values expressed in Kcal/ hr. Source: after Hegger et. al.
Excess heat, if unable to dissipate, raises core temperature, causing the body to stop functioning and leading to a heat stroke. Discomfort in exessive heat signals proximity to this state. Conversely, rapid heat dissipation triggers a similar response.
Thermal balance occurs when we are in equilibrium with our environment, dissipating heat at roughly the same rate it’s generated.
2. Conventional comfort theory
The pursuit of the “ideal” temperature has characterized the 20th century in terms of thermal comfort design. With the integration of ventilation systems into buildings, controlling this air became an obvious consideration.
Moreover, the combination of inexpensive energy and limited environmental awareness promoted this approach, raising the question: What temperature should the systems target?
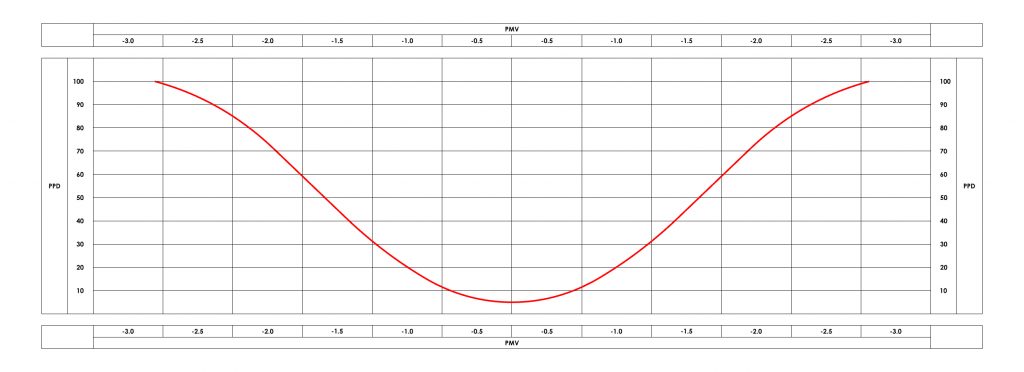
This question prompted climate chamber studies, pioneered by Danish professor Pavel Ole Fanger. These studies aimed to identify a temperature where most individuals would find comfort. Importantly, these studies did not take into account external temperature and conditions. Instead, the focus was on determining the optimal temperature for setting air conditioning systems, with mechanical ventilation serving as the initial starting point (see below).
From these studies emerged equations that as a result would predict the percentage of people displeased (PPD), correlated with the predicted mean vote (PMV). These equations were arrived at by feeding into them the following variables:
- Dry bulb temperature
- Relative humidity
- Mean radiant temperature
- Air velocity .

At the time, it was a great breakthrough, establishing for the first time target temperatures, which were quickly applied as benchmarks in legislation. It also acknowledged that no set of parameters is ever going to be able to perfectly satisfy absolutely everyone. However, though it provided a starting point into thermal comfort studies, it did have its set-back, as it armed architects and engineers alike with “tight” thermal targets to fall back upon, and the fact that they were backed by legislation was a double edged sword as it left little room for improvement or fo adaptive comfort (see below). This of course led to an abuse of energy consumption and established a status quo which was very difficult to challenge.
3. Adaptive comfort theory
The scientific community actively questioned the status quo and studies funding it. They found people reported satisfaction in environments beyond Fanger’s limits. Climate chambers, as described, restricted individuals, hindering clothing adjustments and deviating from interior spaces’ intended function. Researchers pondered whether altering one’s environment could impact thermal comfort (see “The Psychological Effect of Adaptive Comfort Strategies” below).
Probably emboldened by the 1973 oil embargo’s and consequent energy price surge, Humphreys set out to investigated why warmer climates allowed comfort at higher temperatures, and why the opposite seemed to be true for cooler climates.
Finally, this inquiry established a positive relationship between people’s comfort temperatures and outdoor air temperature. Comfort, for the first time, wasn’t solely intrinsic (as proposed by Fanger) but influenced by the mean air temperature in the person’s environment.
4. A model for adaptive comfort
The equation which makes this new model originally suggested by Humphreys put a significant amount of weight into the impact of the mean monthly air temperature. But this was later improved upon to a more generally accepted one by Robert de Dear which limited the impact of the mean air temperature and is:
Tn = 17.8 + 0.31 x Tm
Tn = Comfort Temperature
Tm = Mean Monthly Air Temperature
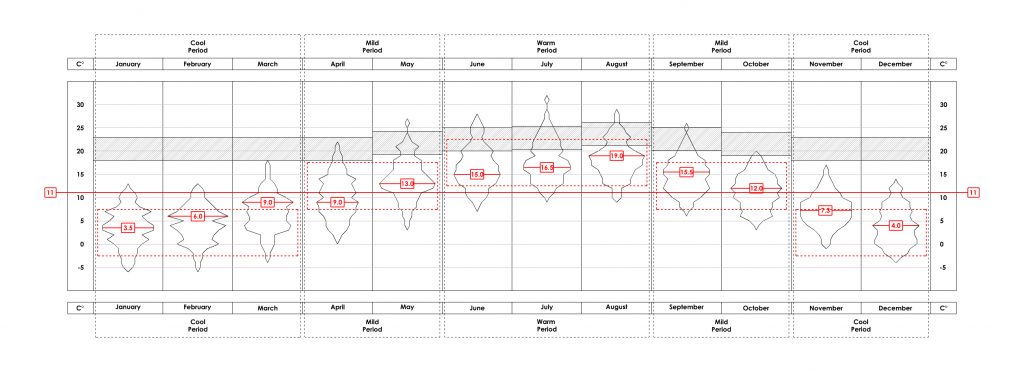
According to this model, in order to create a comfort band which would account for 90% acceptability 2.5°K should be added and subtracted to the resulting “tn”. See in the Figure below how this model would be applied in the Belgian climate which was analyzed in a previous article.

Examining the cool period in the climate analysis reveals no temperatures within our comfort band. Yet, for five months annually, air temperatures alone can exceed it, leading to potential overheating with additional exposures (such as extra solar gains) during those hours.
A one-degree Kelvin increase of the comfort band achieves 80% acceptability. Notably, this model, designed for sedentary activities like office work, establishes upper and lower thresholds of 28°C and 18°C, respectively. It’s worth mentioning that some authors advocate for temperatures as low as 14°C for sleeping, while temperatures above 28°C can be tolerated under special circumstances, such as the possibility of taking a bath in the sea.
5. Adaptive comfort Strategies
Adaptive comfort strategies may be divided into 3 kinds, or levels as suggested by prominent authors in the field (N. Baker):
- Personal
- Building
- Systems and Controls
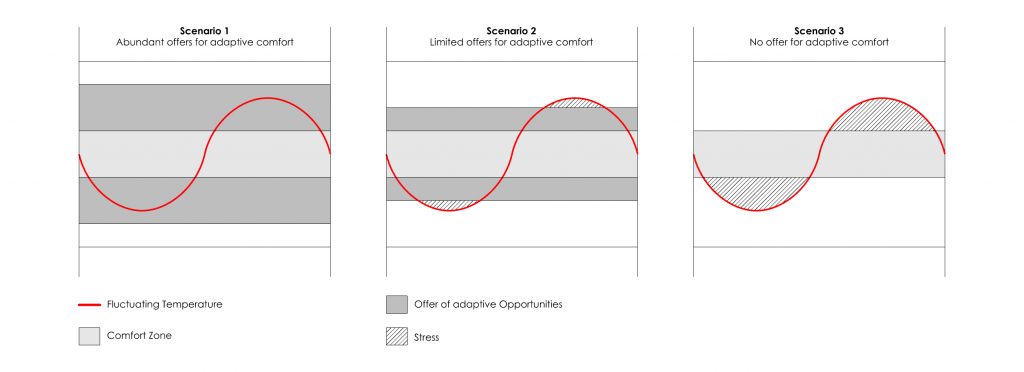
Adaptive opportunities at the personal level could mean the possibility of adding or subtracting clothing layers or moving from a cold place to one exposed to the sun. This may sound simple or mundane, but it is far from it as when we have these possibilities we take them for granted but when we don’t, we quickly get into a state of stress (see below). If one is subjected to a strict dressing code or has their work station fixed to a desk, these possibilities are just not accessible.
Moreover, at the building level, adaptive opportunities would include the operation of adequately designed windows and or blinds. These have to be designed in a way that not only permits their intuitive operation, but also does not get in the way of other factors. For instance, closing a shutter so as to eliminate direct solar gains is a good strategy for thermal adaptation, but not if it means having to turn on the lights to compensate for the lack of daylight. Something in the middle of the road would be ideal if it’s available, the lack of this would probably be irritating, and would thus contribute to thermal stress (see below).
6. The Psychological Effect of adaptive comfort strategies
In many instances, just having the opportunity at hand of exploiting one of the adaptive opportunities already plays a role in our level of comfort. In other words, knowing that one can take off one’s jacket or simply move to a more comfortable position can be enough to expand one’s own comfort band, resulting in comfort without actually undertaking the action. Furthermiore, the opposite is also true. If one is constrained to be seated in one spot in a boring room called a “climate chamber”, one would be acutely aware of one’s level of comfort and would immediately notice any stress. Building on this, studies have shown that people are more tolerant to their environmental conditions when seated near a window. Finally, to better understand this, take a look at the figure below from N. Baker, where a hypothetical comfort band is plotted and 3 hypothetical scenarios of adaptive opportunity are represented in grey along with 3 identical curves which represent temperature fluctuations.


