Exploring the intricacies and nuances of the belgian climate so as to serve as a basis for sustainable design.
Belgium’s climate is often labeled as “bad,” “cold,” or “wet,” but this oversimplification needs clarification. This climate analysis aims for simplicity, briefly explaining technical terms.
Data is derived from the Uccle, Brussels weather station, using Meteonorm software. The dataset, known as a typical meteorological year (TMY), spans the 20-year period from 1991 to 2009 for solar radiation and the 10-year period from 2000 to 2009 for dry bulb air temperature.
Consider the location’s specifics (Latitude 50.8°N, 4°35’E, altitude 105 m.) when assessing different areas. This article doesn’t claim uniform weather across Belgium but uses Brussels as a reference point for contextual understanding.
1. Dry bulb air temperature
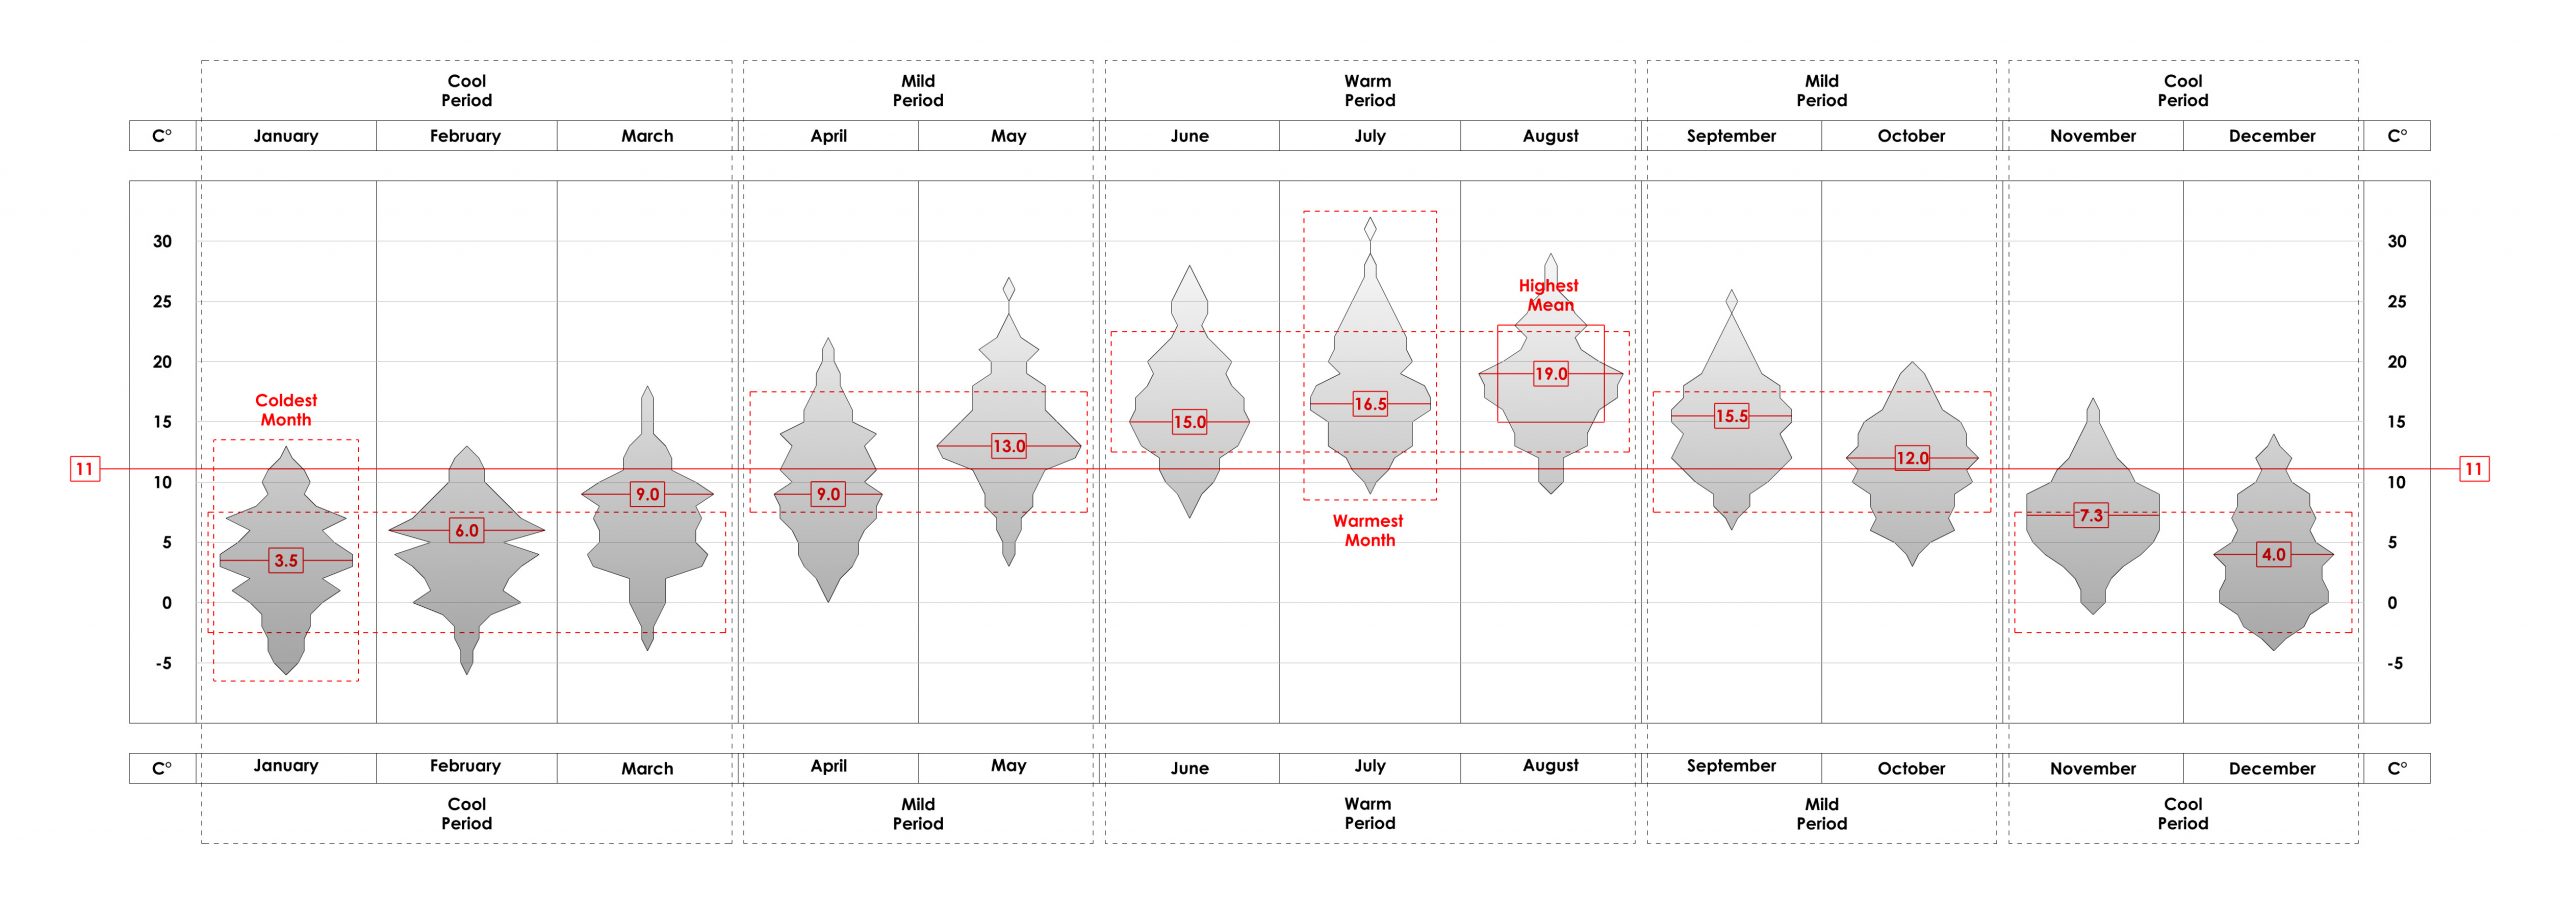
Frequency of Air temperatures for a typical meteorological year (TMY) for Uccle, Brussels.
Key Takeaways
The year can be divided into three climatic periods based on air temperatures.
there is a 5-month cool period from November to March.
A 3-month warm period occurs from June to August.
A 4-month mild period includes transitional times in April, May, September, and October.
July is the warmest month, while August has the highest mean temperatures.
In the first half of the year, shapes are taller and slimmer, indicating higher daily amplitudes.
The dry bulb air temperature graph shows monthly readings, with wider figures representing more common temperatures.
Months are grouped into cool, mild, and warm periods based on air temperatures. From November to March, temperatures range mainly from 0° to 10° in the cool period. Transitional months (April, May, September, October) feature temperatures ranging from 5° to 15°. The warmer period, spanning four months, shows readings primarily between 10° and 20°. January is the coldest month, while July is the warmest due to the buildup of heat.
During the warm period, the earth heats up, with insufficient cooling time before the next heating cycle. The cool period lacks solar radiation to compensate for heat losses during long nights until March.
2. Solar radiation
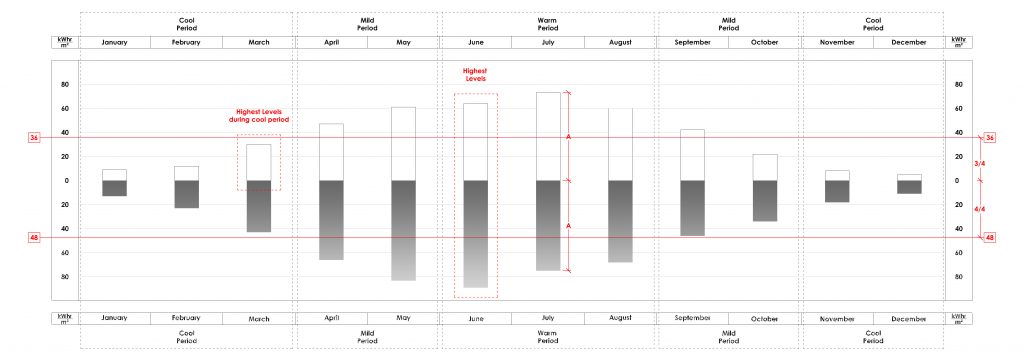
Mean Monthly Solar Radiation broken down into its direct and diffused components for Uccle, Brussels.
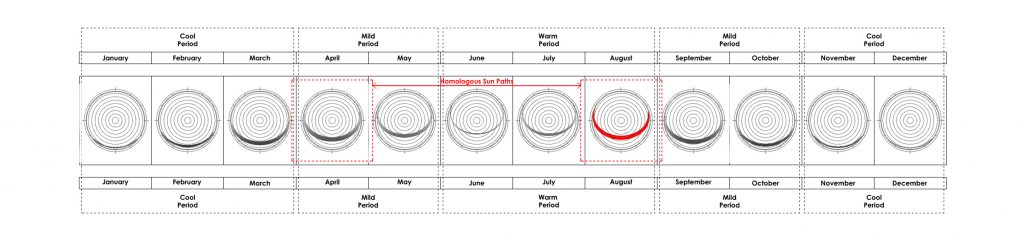
Sun path diagrams for the different months for the latitude of Uccle, Brussels.(50.8°N, 4°35'E)
Key takeaways
The direct component is 3/4ths of the diffused on average.
June is the month with the highest Global horizontal radiation.
March has very high levels of direct solar radiation, which can be exploited for passive heating.
During July the direct component’s has a higher impact upon the global. Shading should be provided.
The sun path during the month of August when the direct component would likely result in overheating is homologous to the sunpath of the month of April when the direct component would most likely be a benefit. This suggests moveable shutters/louvers may be required for these times of the year.
The global horizontal solar radiation is presented, separated into diffused and direct components, the former indicated with a darker color. Monthly cumulative mean values are depicted in the bar graph.
Observing the graph, we notice that the direct component intensifies from the winter solstice (December 21st) to the summer solstice (June 21st). While June holds the highest global component, July sees the direct component peak, constituting half of the global component. On average, the direct component is about ¾ of the diffused component.
Crucially, the solar trajectory in August, when solar gains may be undesired, mirrors that of April when it may be desired.
This suggests movable solar protection for these months may be a good solution. In contrast, fixed solar protection for June and July seems more suitable.
3. Daylight (Lux levels)
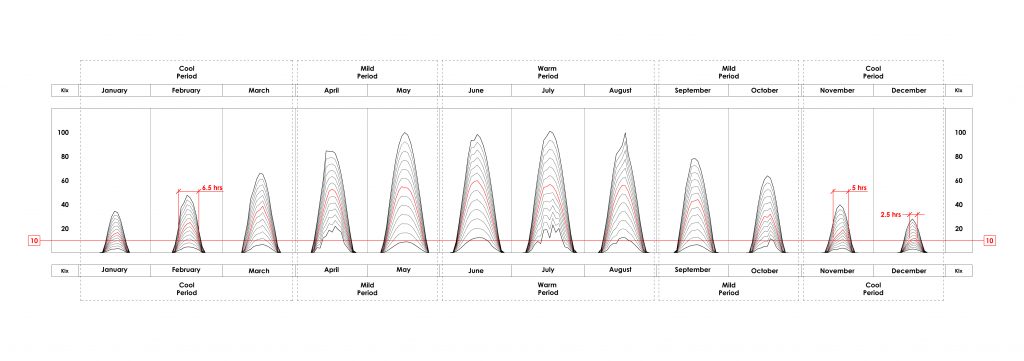
Hourly diffused mean monthly horizontal lux levels for Uccle, Brussels
Key takeaways
Considering that we require 7.5 kilolux (Klux) in the environment in order to have the possibility of illuminating a space with natural light at a given time, on average this will be achieved only 5 hours/day during the months of December and January.
One should leave out of calculations the months from November to January knowing that adequate levels for the rest of the time should be feasible.
Although lux values are correlated with solar radiation ones, that’s about where the similarities end in terms of building design.
Given that Belgium has a predominantly cloudy sky (see below “cloud cover”) the values for the diffused component are the ones to be taken into consideration.
Belgium’s predominantly cloudy sky makes the diffused component crucial for consideration. We require 7,500 lux from the diffused component in order to provide adequate natural illumination. In this climate these levels are attained on average only 5 to 6 hours per day from November to January. Therefore, seeking to naturally illuminate throughout this period is just not the right objective. This level of demand on a space will be just too constraining. This will also result in excessive solar gains that would be hard to manage.
4. Wind
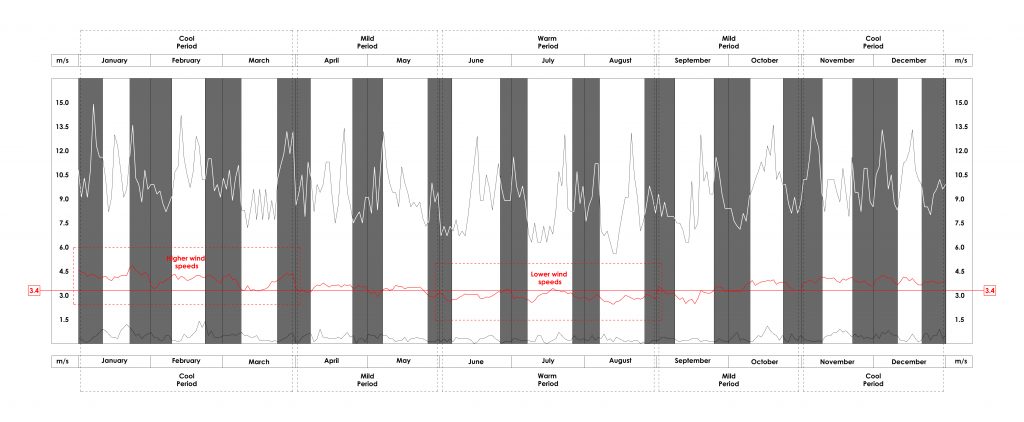
Mean monthly hourly wind speed in m/s in Uccle, Brussels
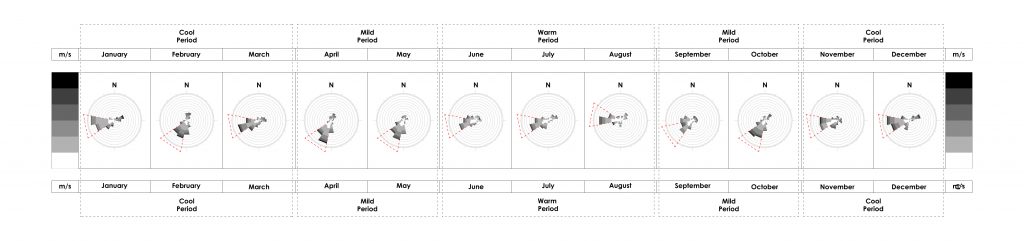
Monthly Wind Roses for Uccle, Brussels
Key takeaways
The average wind speed is 3.4 m/s
Wind speeds tend to decrease during the warmer period
Peak wind speeds tend to happen during the day hours.
The predominant wind direction throughout the year is West, South-West.
During the warm period the predominant wind direction shifts slightly to the West.
Examining the wind roses for each of the twelve months reveals a consistent west-southwest prevailing wind direction. During the warm period, there’s a slight shift, making it predominantly west.
In the graph depicting mean monthly hourly wind speed, darker vertical stripes indicate nighttime. The bottom line signifies the lowest mean air speed, the top one the highest, and the red one the average mean, deviating from the annual average of 3.4 m/s.
The graph implies that the highest wind speeds consistently occur throughout the cool period, reaching their peak, while they are lowest during the warm period. Additionally, wind speeds generally decrease during nighttime.
5. Cloud cover
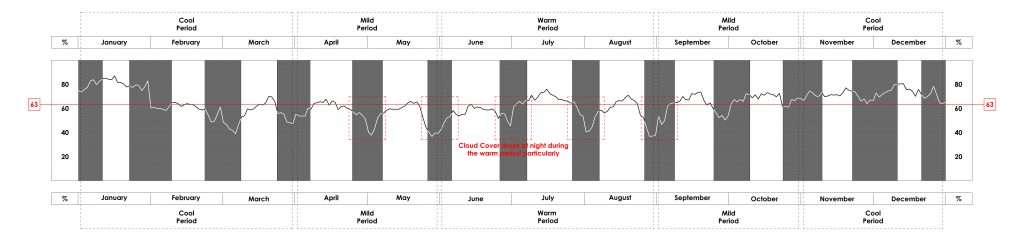
Hourly mean monthly cloud Cover for Uccle, Brussels.
Key takeaways
There is higher cloud cover during the day than during the night.
There is lower cloud cover during the first half of the year, particularly during the day.
During the warm period cloud cover at night is significantly lower than during the cool period.
Analyzing mean hourly data for each month consistently reveals higher daytime cloud cover than during the night. This disparity becomes more pronounced in the warm period, with nighttime levels consistently dropping to about 40%. However, this difference diminishes in the mild period and even more so in the cool period.
Another observation is the lower cloud cover percentage in the first half of the year compared to the second half. This aligns with the rainfall graph below, indicating a consistent correlation between cloud cover and rainfall patterns.
6. Rainfall
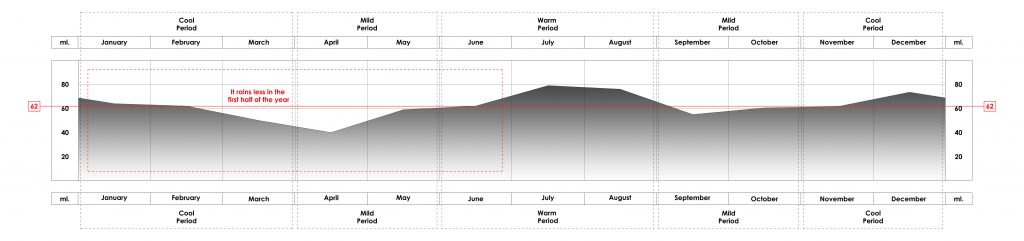
Rainfall in mm. for Uccle, Brussels.
Key takeaways
The Average Rainfall is 62 mm./month
It rains more in the second half of the year.
Brussels experiences an average monthly rainfall of 62 mm. Rainfall is notably lower in the first half of the year, reaching its minimum in April (40 mm.) and peaking during the warmest months, July (79 mm.) and August (76 mm.).
To put this into perspective, approximately 6,200 liters of rain fall monthly on a 100 m2 roof. At the current water price of €5.053, this translates to slightly over €30 worth of rainwater per month. Understanding these patterns is crucial for optimizing water management strategies.
7. Coldest and Warmest Weeks
In order to better understand the nuances of the climate and incorporate these into any design, it is important to examine the worst case scenarios or “critical points”. These critical points in this case would be the week around the warmest and coldest days of the year.
7.1. Coldest week
Coldest Week mean hourly values for solar radiation and air temperature.
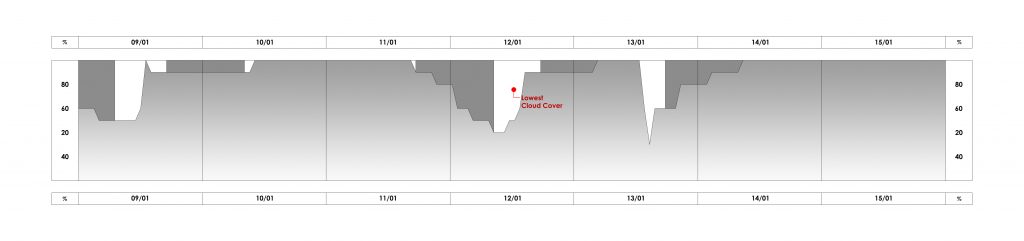
Hourly values for cloud cover during the coldest week
Key takeaways
The coldest day (January 12th) is the day when cloud cover drops the most.
Extra solar radiation in clearer days does not seem to compensate for the additional heat that is dissipated due to the lower cloud cover.
The coldest week of the year tends to be from January 9th to January 15th, which is here presented in the graph. It must be pointed out that the coldest day of this week, January 12th, is the one with the highest global solar radiation which benefits of little cloud cover. It seems that what makes this day so cold is the lack of cloud cover, particularly during the cold hours of the previous night. This lack of clouds allows the earth to radiate its heat to the night sky, with little or no solar gains to compensate for this loss during this period. The opposite is true on the previous day, which is the warmest day of this week. One can see that the days nearing January 11th and cloud cover was particularly high during the night.
7.2. Warmest week
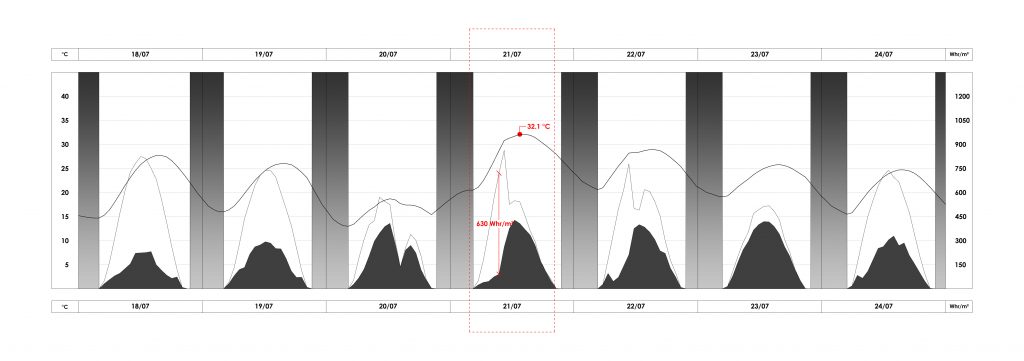
Warmest Week mean hourly values for solar radiation and air temperature
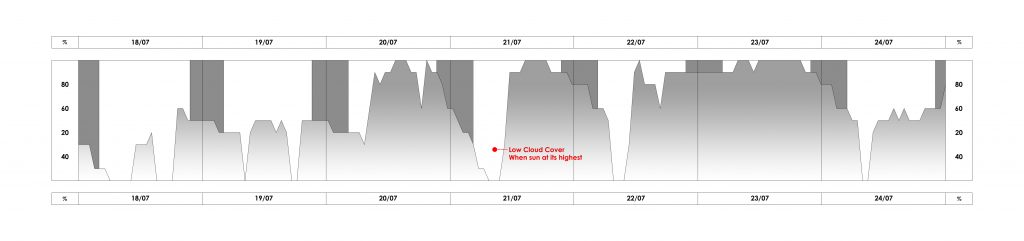
Hourly values for cloudcover during the warmest week.
Key takeaways
The temperature at night doesn’t seem to drop below 15°C
During the warmest day of the year (July 21st), the main difference as compared to all other days of the same week is that during the previous night the temperature didn’t drop as much as it did on the other nights. Not only that, but it actually seemed to climb about 5°C during that night. Looking further back one can see that the previous days of that same week were rather clear during the day with higher cloud cover at night, producing the same effect it had during the coldest week. Meaning, that heat was being allowed in during the clear days but was then trapped during the cloudy nights.
8. Conclusions
Windows should be kept at a low window to floor ratio, seeking to provide adequate illumination only during 10 months a year.
Wind protection should be provided for West, South west wind directions.
Designing for passive solar heating during the cool period seems not worth it as most of the global component during this period comes from the diffused component.
In this climate, prioritizing heat loss reduction during the cool period is crucial. Passive heat gains won’t compensate for significant losses over approximately half of the year. Compact designs and low window-to-floor ratios are advised to minimize heat loss. Windows should provide enough daylight to meet requirements for ten months. Exceeding this may lead to issues like overheating in the warm period, unless solar protections are considered.
Mitigating excessive solar gains in the warm months is essential due to the direct component comprising about half of the global solar radiation. This becomes more critical with a warming climate. Fixed overhangs and louvers should be tailored for June and July, while operable ones are recommended for August.
For outdoor spaces we should consider wind protection, especially from a west, south-west wind direction. This extends the usability of exterior spaces throughout the year. Integrating these strategies ensures a more effective response to the specific climate challenges.